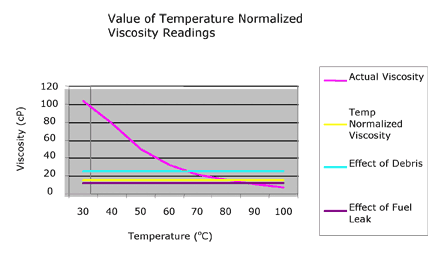
In order to determine whether oil is failing, it is essential to normalize the viscosity readings to a single temperature. At the normalized temperature one can then readily see a change due to contamination or degradation. An example of the temperature-viscosity relationship is shown in Exhibit 1 below. In that Exhibit, the pink line indicates the characteristic viscosity values for a 10W30 lubricating oil at temperatures ranging from 30°C to 100°C. The yellow line normalizes the viscosity values to a single temperature, in this case 80°C. Obviously the same oil at the same temperature has the same viscosity value of 18 cP. Temperature-normalized measurements above or below the yellow line indicate problematic oil characteristics. In this way we can use actual running data at all of the operating temperatures, normalize them and then know if the oil is within the proper range. We refer to these normalized viscosity values as “Temperature Compensated Viscosity” or TCV.

Exhibit 1: Temperature and Viscosity Relationship for a 10W30 Lubricating Oil
Fortunately, oils and many other fluids exhibit characteristic relationships between temperature and viscosity. These relationships are readily modeled mathematically, allowing the temperature–compensated viscosity for any point to be calculated at a selected reference temperature. In Exhibit 1, for instance, the reference temperature was set at 80°C. Every viscosity-temperature data point is then recalculated mathematically assuming the reference temperature. In this exhibit, the 10W30 oil shows a temperature compensated viscosity (TCV) of 18 cP at the 80°C reference temperature across the whole range of the instantaneous temperatures and viscosity measurements. Readings above the yellow TCV line indicate a thicker-than ideal viscosity for 10W30, possibly caused by debris of one type or another. However, the purple TCV line indicates below-target viscosity which could be caused by a fuel or coolant leak. Adjusting all viscosity-temperature values to TCV allows trends in oil viscosity to be spotted readily.
This paper, written by Rob Kasameyer and Curt Felix of Cambridge Viscosity, demonstrates how real-time oil viscosity measurement and trending can identify lubricant problems well before they cause equipment damage or failure.
Known for innovation in viscosity measurement and control, Cambridge Viscosity specializes in the industry's most accurate, reliable, and easy-to-use viscometers for research laboratories and process environments.
Cambridge Viscosity, Inc.
50 Redfield St, Suite 204
Boston, MA 02122 USA
781 393-6500
Email: Sales@CambridgeViscosity.com